Tech Versum: Explore the Future of Technology
Dive into the latest trends and innovations in technology with Tech Versum.
Data Visualization Software That Will Make You the Picasso of Analytics
Unlock your inner Picasso! Discover top data visualization tools that turn analytics into stunning masterpieces.
Top 5 Data Visualization Tools to Transform Your Analytics
In today's data-driven world, effective data visualization is essential for transforming analytics into actionable insights. Utilizing the right tools can significantly enhance your ability to portray complex data clearly and understandably. Here are the Top 5 Data Visualization Tools that can help you take your analytics to the next level:
- Tableau - Renowned for its powerful capabilities, Tableau enables users to create stunning visualizations and dashboards. With its user-friendly interface, it is perfect for both beginners and data professionals.
- Power BI - Developed by Microsoft, Power BI allows businesses to visualize data and share insights across their organization, making it a powerful tool for collaborative analysis.
- QlikView - Known for its associative data model, QlikView offers users rapid data analysis and real-time decision-making capabilities.
- D3.js - For those with coding skills, D3.js is a powerful JavaScript library that creates dynamic visualizations and is ideal for customizing visuals according to specific needs.
- Google Data Studio - This free tool from Google allows users to convert data into informative, easy-to-read, easy-to-share dashboards. You can access it here.

How to Choose the Right Data Visualization Software for Your Needs
Choosing the right data visualization software can significantly enhance the way you interpret and present your data. Start by evaluating your specific needs. Consider factors such as the complexity of the data you will be working with, the types of visualizations you prefer, and the level of interactivity required. It’s essential to explore a range of software options, from open-source tools like Tableau to comprehensive platforms such as Microsoft Excel. You might also want to utilize resources like Creative Bloq to compare various tools and their unique features.
Another critical aspect to consider is the user-friendliness of the software. An intuitive interface can save you countless hours and reduce the learning curve. Look for applications that offer extensive support resources, including tutorials and user forums. Moreover, consider whether the software integrates well with other applications you use, such as Google Sheets or Power BI. Ultimately, the best data visualization software for you should empower you to convey insights effectively, streamline your workflow, and present your findings in a visually appealing manner.
Why Data Visualization is Essential for Effective Decision-Making
Data visualization is essential for effective decision-making as it enables organizations to translate complex data sets into understandable and actionable insights. By converting raw data into visual formats such as charts, graphs, and maps, stakeholders can quickly grasp trends, patterns, and outliers that may not be immediately apparent in numerical form. According to a study by Data Visualization Society, decision-makers who utilize visual tools are often able to make more informed choices in a fraction of the time, enhancing overall productivity and responsiveness to market changes.
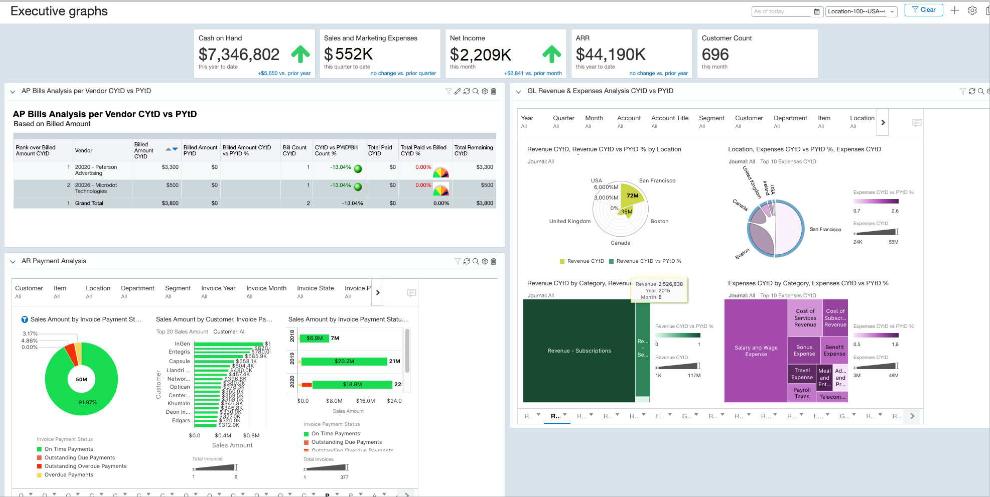
Furthermore, the use of data visualization fosters better communication among team members and stakeholders. Visual aids bridge the gap between technical and non-technical audiences, allowing for clearer discussions regarding data-driven strategies. For instance, an interactive dashboard can bring life to numbers by allowing users to explore data from different angles. As noted in Forbes, effective visualization not only helps to clarify information but also facilitates collaboration, empowering teams to align their efforts and drive better outcomes.